This Section will provide to you the enviormental features and sorroundings of Windhoek, Namibia.
WHAT WILL YOU SEE?
* Windoek is a city with 1572km of coastline, an area of 825,418sq km. * Windhoek has approximetly 268, 129 habitants or 2.5 per sq km. *Windhoek contains alot of natural resources like: daimonds, copper, uranium, gold, silver, lead, tin, lithium, cadmium, tungsten, zinc, salt, hydropower and fish.
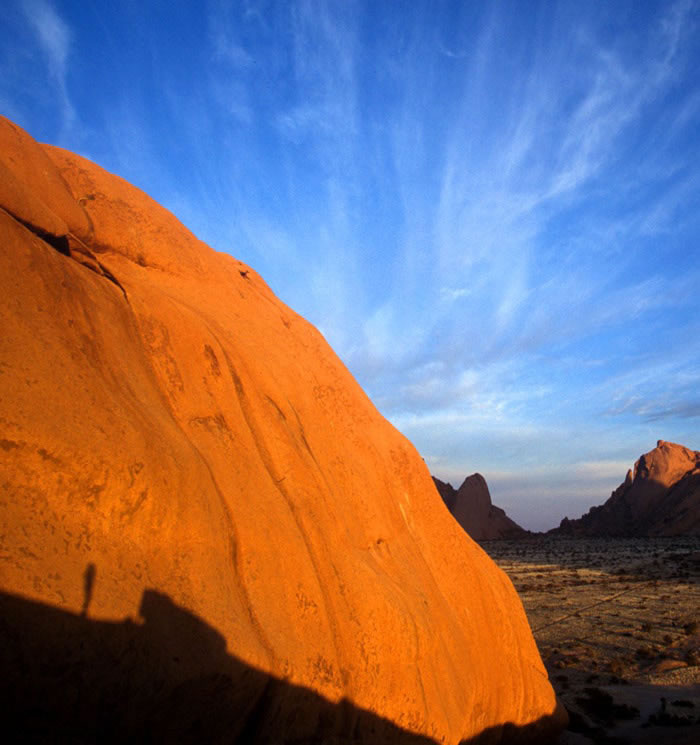
* Its terrain is of mostly high plateau with Namid desert along the coast, and Kalahari desert in east
IN THE PICTURE IS AN EXAMPLE OF ITS TYPE OF MOUNTAIN DESERT.
CLIMATE:
Windhoek's climate isdesert, hot, dry, rainfall, sparse, and erratic. Is located in most arid African country. By the cold atlantic, and hot southern, African Basin.
CLIMATE CHART BELOW:
Windhoek, Namibia
| Month | Average Sunlight (hours) | Temperature | Discomfort from heat and humidity | Relative humidity | Average Precipitation (mm) | Wet Days (+0.25 mm) | ||||
|---|---|---|---|---|---|---|---|---|---|---|
| Average | Record | |||||||||
| Min | Max | Min | Max | am | pm | |||||
| Jan | 9 | 17 | 29 | 9 | 36 | Moderate | 50 | 27 | 76 | 8 |
| Feb | 9 | 16 | 28 | 7 | 34 | Moderate | 62 | 35 | 74 | 8 |
| March | 8 | 15 | 27 | 4 | 34 | Moderate | 59 | 33 | 79 | 8 |
| April | 9 | 13 | 25 | 2 | 31 | - | 55 | 30 | 41 | 4 |
| May | 10 | 9 | 22 | -2 | 32 | - | 51 | 24 | 8 | 0.9 |
| June | 10 | 7 | 20 | -3 | 26 | - | 50 | 24 | 0 | 0.3 |
| July | 10 | 6 | 20 | -3 | 25 | - | 42 | 18 | 0 | 0.1 |
| Aug | 11 | 8 | 23 | -4 | 29 | - | 34 | 14 | 0 | 0.1 |
| Sept | 10 | 12 | 25 | -1 | 33 | - | 28 | 11 | 3 | 0.3 |
| Oct | 10 | 15 | 29 | 2 | 34 | Moderate | 27 | 13 | 10 | 2 |
| Nov | 10 | 15 | 29 | 1 | 36 | Moderate | 34 | 18 | 23 | 3 |
| Dec | 10 | 17 | 30 | 3 | 36 | Moderate | 41 | 23 | 48 | 6 |
In This two graph it is basically describing whta the average temperature, humidity, sunlight, discomfort from heat and humidity, and the wet days. This is described on the first map, it says the approximation of all the days of the week. This information is gotten from www.bbc.com . The second graph is from the same page and it is to average and see te approximation fo how much rainfall it has been and how is the temperature in the past year.